Leveraging Metric Trees for Retail Analytics


North Star metrics, like profit or marketing pipeline conversions, are single key metrics capturing a core business value. Retail organizations wishing to adopt more data-driven practices can benefit from metric trees – an analytics tool that, when used correctly, can:
- Quickly and clearly tell the story behind a North Star metric by drawing attention to the various inputs driving it
- Identify smaller organizational changes that can make a large positive impact
Below, we’re discussing what a metric tree is, how they are structured, and the benefits of leveraging metric trees for retail analytics.
Metrics Trees for Retail Analytics
Analysts frequently use these metrics to communicate important information to stakeholders and drive strategic direction. However, reporting solely on a North Star metric itself overlooks the inputs driving this number. For example, the statement, “business’s profits increased last quarter,” does not explain why these profits are up. Realistically, North Star metrics are not isolated incidents; they are the culminating output of many different inputs, like sales volume or price per unit sold.
What is a Metric Tree?
A metric tree is an analytical model and visual flow that breaks down a North Star metric (like profit) into its various inputs (like sales volume and price per unit) while showing a clear, logical, and mathematical relationship between the inputs as they tie up to the North Star. Ideally, this tool provides a distinct and actionable framework to easily analyze relationships between metrics and identify which act as “levers” for success to most heavily impact the North Star Metric. Analysts can use the visual tool to break a large number down into more digestible slices, assess each slice, and identify what smaller changes a business can make to have a positive snowball effect on the North Star metric.
Metric Tree Structure
There are three key components of a metric tree:
- North Star Metric: A primary, overarching metric that captures a core component of business performance and aligns with the business’s long-term goals (i.e., profit)
- Inputs: The various measurable factors or activities that directly impact the North Star Metric (i.e., sales volume, price per unit)
- Levers for success: Specific actions or strategies that can be adjusted for individual input metrics to improve the North Star Metric (i.e., adjusting price per unit)
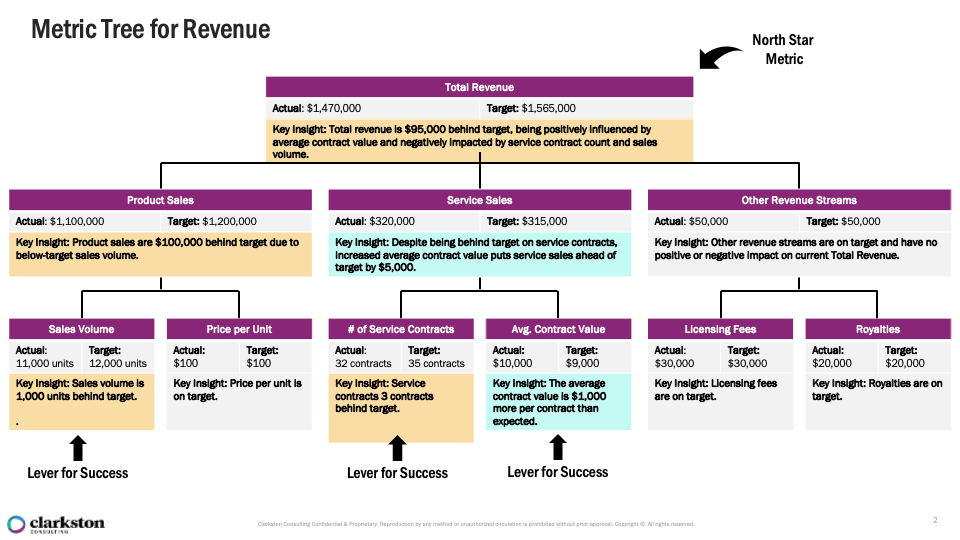
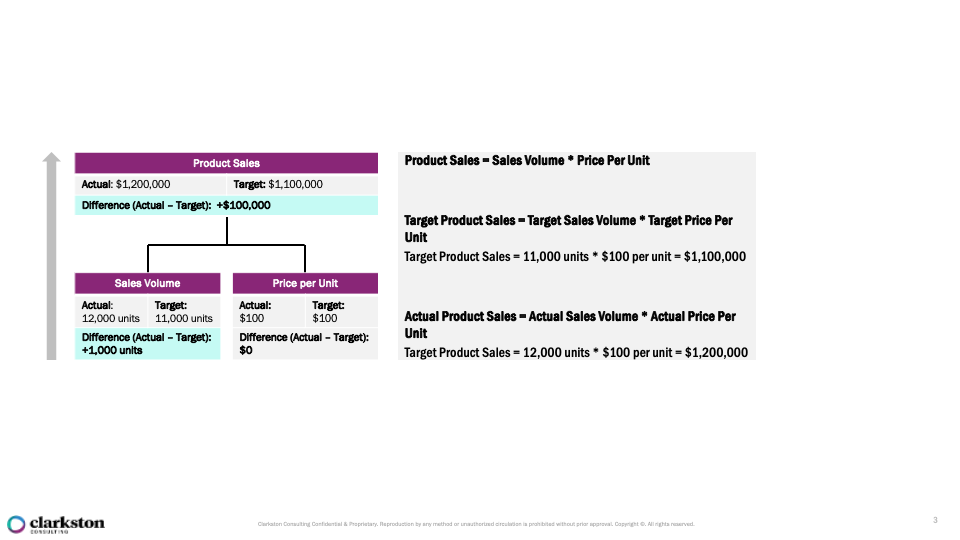
The above metric tree looks at a common organizational North Star (Revenue) and breaks it down into three inputs (Product Sales, Service Sales, and Other Revenue Streams). Those revenue streams are then broken down into their components. This process can continue until analysts believe all relevant inputs to the North Star metric are captured. Then, branches at a lower level can be combined to calculate the value of the metric they contribute to on the level above. For example, Product Sales is the product of its inputs – Sales Volume x Price per Unit.
Further analysis of the input metrics draws multiple useful insights, such as which metrics are ahead or behind their goal, which have growth potential, and which metrics can be adjusted to improve the North Star metric. Essentially, viewers can simultaneously see what is working for the retailer while quickly identifying areas for improvement – making this an excellent tool for finding quick wins.
For example, the metric tree for revenue shows that while the average value of a service contract is $1,000 per contract ahead of its goal, the number of contracts and sales volume have fallen behind target, putting Total Revenue $80,000 behind target. The conclusions that can be made analyzing these numbers are straightforward – sales teams should focus on identifying opportunities to increase sales volume, close additional sales contracts, and continue to leverage the higher average contract value. The example provided here is a simple one—retail companies, naturally, aim to increase sales while maintaining profitable prices (we use this example to illustrate the following point). The true strength of the metric tree lies not only in the specific insights it generates, but in the speed and clarity with which it delivers quick, data-driven insights and an understanding of the relationships between controllable inputs, and organizational goals
Benefits of Metric Trees
Metric trees can provide many advantages to retail businesses looking to identify quick wins and lasting improvements. The clarity and simplicity of the metric tree’s structure provide the following benefits:
1. Clear, Transparent, and Data-Driven Focus:
The simplicity, low word count, and clear relationships between metrics drives data-driven decision-making, allowing retail teams to quickly identify which metrics are levers for success and drive prioritization of efforts accordingly. For example, a retailer might use a metric tree to discover that customer retention rates are a more critical lever for growth than customer acquisition, prompting them to shift resources towards enhancing loyalty programs. Additionally, if sales performance lags in a specific region, a metric tree can reveal product availability or pricing strategies as key drivers, enabling more targeted action in these areas. This transparent focus on the most impactful metrics ensures that teams can prioritize their efforts based on data-driven insights, thereby driving more effective decision-making.
2. Highly Customizable Depending on Goals:
While most retail organizations will share several North Star metrics, the criteria used to calculate these metrics and their key drivers can vary greatly between these businesses. The branches of a metric tree can be hand-picked and structured according to key organizational business drivers, and this customization helps ensure that the tool drives insights uniquely tailored to a specific organization. For instance, a luxury retailer might prioritize metrics related to customer exclusivity and high-value transactions, while a mass-market retailer may instead center attention on sales volume and customer acquisition. Metric tree branches can easily be tailored to reflect these priorities, helping businesses focus on the most pertinent data for their specific goals. This flexibility ensures that the insights generated are highly relevant and actionable, allowing retail companies to make data-driven decisions that align with their unique growth strategies, customer segments, or operational challenges.
3. Friendly to All:
The direct emphasis on metrics in a simple tree structure ensures alignment among a range of viewers with different levels of data literacy. The visual flow facilitates easy digestion of which inputs impact the North Star metric, making advanced analytics more intuitive for both novice and experienced analysts. This ease of digestion ensures that key insights are quickly accessible, empowering decision-makers at all levels of the organization to take actions based on clear, actionable data. The visual flow simplifies complex datasets, allowing teams to move from analysis to decision-making with minimal friction.
4. Unites Workstreams Towards a Common Goal:
Metric trees prevent data silos by uniting data from different workstreams into a single, cohesive framework that visually connects their contributions to overarching goals. The example metric tree shared integrates metrics such as sales volume, average contract value, and licensing fees, highlighting interdependencies across workstreams, such as how service contracts impact total revenue alongside product sales. This unified view can be used to encourage collaboration between departments, ensuring everyone works toward the North Star metric rather than focusing solely on isolated metrics.
Who Benefits from Metric Trees?
Metric trees benefit many stakeholders, including executive leadership, managers, and analysts. Executives can rely on metric trees for strategic alignment and performance tracking, as they offer a clear view relationships between key inputs guiding a North Star metric in a way that facilitates focus on high-level strategic decision-making rather than operational details. For example, executives could use the example metric tree provided to make strategic decisions to address performance gaps, such as boosting product sales through targeted promotions or closing a 3-contract shortfall by upselling service agreements. At the same time, they can capitalize on higher-than-expected contract values to expand premium offerings while maintaining strong-performing revenue streams like licensing fees and royalties, all while being able to tie these decisions back to the company’s overall objectives.
Additionally, managers can use metric trees to focus on more tactical and operational actions that directly impact individual performance inputs. Unlike executives, who focus on strategy and resource alignment, managers are closer to day-to-day execution. Referring back to the example metric tree, a manager could analyze successful contracts to replicate high-value strategies, or they could identify and replicate the strategies used to drive steady licensing fees and royalties that are meeting the target.
Finally, analysts and business translators appreciate the tool’s efficiency in generating insights and quickly telling a story. Successful data storytelling makes advanced analytics and complex data accessible and digestible to a wide audience to facilitate decision-making – and metric trees do just that. The example metric tree provided clearly shoes the “why” behind both performance gaps and successes, greatly simplifying communication of data.
As developments of AI and integrated business increase, it is important for organizations approach analytics with the intention of making them useful. For retail businesses, metric trees are an excellent foundational tool that provides immediate value to teams without strong analytics backgrounds. Metric trees make advanced analytics accessible to a wide audience by visualizing complex data in a highly intuitive manner. For this reason, metric tree implementation is a strong first step organizations can take as they begin to build a roadmap to advanced analytics and AI.
How to Get Started?
Metric trees are most effectively built by cross-functional teams that include data analysts and business translators. While analysts are crucial for constructing the tool and ensuring the metrics are relevant, they may lack insight into management’s broader goals, potentially causing a disconnect between the data and executive objectives. Here, it is helpful to lean on business translators to help bridge this gap by aligning the analysts’ insights with management’s priorities and ensuring that the data is clearly understood by executives and other stakeholders. This collaboration is essential for making metric trees a powerful organizational tool.
If you’re curious about how to get started or learn more about metric trees and other organizational tools to use data to improve your operations, reach out to our data experts.