Using Analytics to Improve In-Store Retail Experiences

The in-store retail experience for customers is under more scrutiny than ever before. As a result, brands are constantly trying to innovate their experience to keep their customers engaged and loyal. The focus is often put on standalone technology to improve visits, and while smart mirrors or interactive displays are engaging, they can also be costly to roll out to hundreds of stores. Another route companies have gone for in-store retail is offering unique or custom service offerings such as clienteling or appointment-based personal shopping experiences. These can have great benefits as well but may not be the right approach for all brands. Where retailers may be missing an opportunity, however, is by leveraging analytics to improve on things they are already doing.
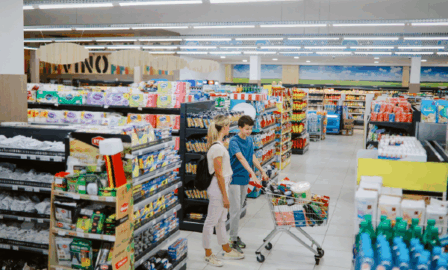
Optimizing SKU Mix for In-Store Retail
The goal of the retailer has been and will continue to be to have the right product in the right place at the right time. We’ve seen COVID-19 accelerate a shift of sales from brick and mortar to online channels, diversifying where the product needs to be located in order to complete the sale. With this in mind, it’s likely we see more retailers using their in store retail footprint as mini-fulfillment centers. Even without this pressure, it’s still critical that your best sellers be available, and that less floor space is given to the fringe products that don’t have a significant impact on the top line. Ultimately, the best customer experience includes the customer finding what they came for – and analytics can play a key role in ensuring this happens.
Improving capabilities to analyze demand at a hyper-localized level can pay dividends for retailers by getting consumers the products they want while avoiding out of stocks or slow-moving inventory. Thinking about your data differently can enable you to break out information you already have into features that tell a more complete story of demand. For example, not only looking at the top selling SKUs, but breaking those down into features of the product like material, style, color, and more in addition to detailed regional data about the retail location will better explain the drivers of demand for that store. Localizing merchandising in this way may require extra effort, so be sure to explore options for automation to avoid adding more work to your team’s plates; to drive change and improvements, insights must be paired with actionable steps to guide your planning teams.
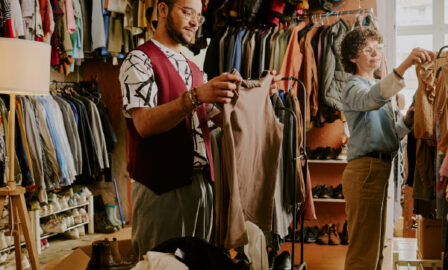
Improving the Shopper to Store Associate Ratio
Retailers often rely on a “tried and true” approach to their scheduling of associates in their stores, which typically means a ‘gut feel’ guess which evolves over time as the best estimate of how many people they need patrolling the floor at a given time. However, there’s a very real impact to this number being off in either direction. Having too many people can eat away at margins due to higher employee costs and having too few can cause conversion dips due to not having enough staff to answer questions and facilitate the shopping process.
Monitoring data on foot traffic in stores and comparing it to the number of employees you should have on the floor and behind cash registers can optimize conversion rates and keep lines from getting too long that they become a deterrent for shoppers. As more products are available online, many shoppers who come to the store are looking for advice or direction from store associates. Identifying and then maintaining an optimal ratio of shoppers to employees is crucial to the in-store experience, especially during peak hours. To do this effectively, retailers need to be able to forecast foot traffic far enough in advance to set staffing schedules. Advanced analytics allows for this, even incorporating things like weather patterns and regional holidays to catch nuance in seasonal patterns.
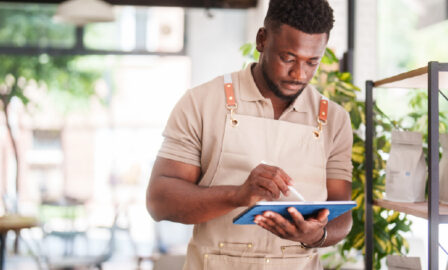
In addition to every-day staffing models, advanced analytics can also help with recent challenges faced as a result of the COVID-19 pandemic. With retailers reopening stores during COVID-19, there are many talks of staffing in waves and having the ability to track the employees who share shifts in case of an employee getting sick. The retail environment already faces a tricky task to ensure proper coverage on short notice when associates call out sick, and COVID-19 only increases the need for streamlined access to workforce data to understand the network of who worked together and when.
Promotion Optimization
As the country navigates the uncertainty of COVID-19, retailers are faced with the challenge of how to drive traffic to their stores. Activation of services like curbside pickup and ‘buy online, pickup in store’ will help, but the return of season-ending blowout sales will also serve as lures to bring in customers on the promise of heavily discounted merchandise. However, simply putting in place promotions to temporarily increase revenue can be short sighted. It’s important to measure and understand how promotions are impacting all aspects of your business – from store traffic to sales across categories – and consider how the impacts affect various customer segments or geographies differently.
The phased reopening of the country’s businesses provides an opportunity for in-store retailers to run A/B testing on promotional effectiveness within the context of our new normal. While there are valuable insights to be gleaned from other historical disruptions, this year’s challenges are a beast of their own that will benefit from ongoing data collection and analysis. Running small-scale promotional events and comparing their effectiveness provides an agile approach to understand what will win in a landscape that will continue to evolve over the coming months. Those who adapt and are able to nimbly offer the right incentives will be well-positioned to navigate this year and carry those capabilities into the future. The first step in determining promotional effectiveness is calculating a baseline using factors like product trends, seasonality, discounted pricing, and competitor promotions. For retailers, promotional effectiveness should be measured not only by increased units sold from baseline and revenue, but also by increased traffic. Each promotional event should carry a success metric for increasing traffic, conversion, units sold, or revenue to paint a holistic picture in line with strategy.
Overall, retailers are just starting to tap into the power that analytics can provide them in all areas of their operations. With a growth in understanding of analytics and their capabilities, retailers can better serve their customers through a challenging 2020 and beyond.