Sales and Marketing Analytics: Understanding Your Organization’s Maturity

As companies learn the benefits of analytics and make strategic investments in capabilities such as automation, predictive maintenance, and simulation, analytics maturity will vary across and within organizations. Our clients are regularly interested in finding out how they compare with their industry, so we work with them to report on how they fall into these different phases. Sales & marketing in particular has an incredibly high ceiling for sales and marketing analytics capabilities. Relevant activities include anything ranging from harmonizing data across a multitude of sources, to post-event analysis and evaluating the ROI of specific trade or marketing spend. We’ll explore four levels of maturity within the context of sales and marketing analytics: diagnosing, evaluating, simulating, and optimizing.

Diagnosing the Organization
What does an organization look like at the diagnosing level? What activities occur for organizations or groups at this level? To start, a company might recognize value in understanding what consumers are purchasing or what occurs in-store, and purchase point-of-sale (POS) data from providers like SPINS, IRI, or Nielsen to accomplish this. Those working with POS data likely understand what is ‘standard’ and can use their sales & marketing subject matter expertise to diagnose anomalies or inconsistencies in the data.
To provide “real world” context, a manufacturer may see there was promotional volume occurring in a week with no planned promotional activity. When analysts have access to POS data that has been harmonized with their promotional plan, it is easy to recognize an error which may have otherwise gone under the radar. To better diagnose issues with promotional plan execution, an analyst may want to remodel the volume data to attribute different factors – both promotional and non-promotional – to the total volume to then recalculate incremental volume. That way, they can tie promotional activity in store with the lift in sales volume to get the accurate picture of promotional effectiveness. Other examples of helpful analyses that that may be recognized at the diagnosing level are things like measuring lift and monitoring retailer adherence to promotional plans.
As with all sales and marketing analytics, the work is only as valuable as what actions you take from it. Even at the diagnosing level, organizations should think about next steps. For example, outputs can be used to evaluate promotional plans by customer, evaluate how competitor activity affected their promotions, asses promotional effectiveness or ROI of a specific campaign, or use remodeled data to feed back into their TPM system.
Evaluating Sales and Marketing Analytics
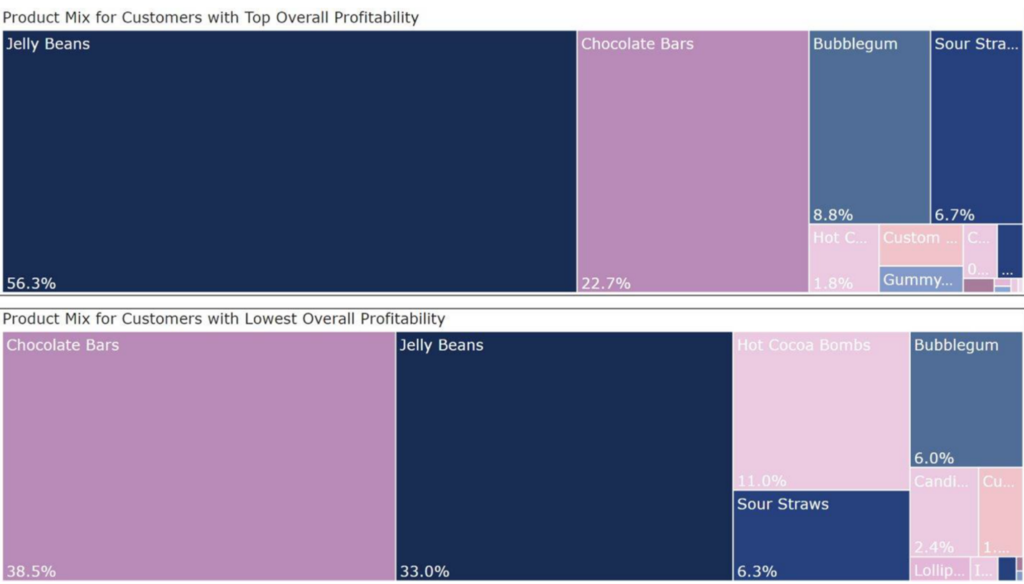
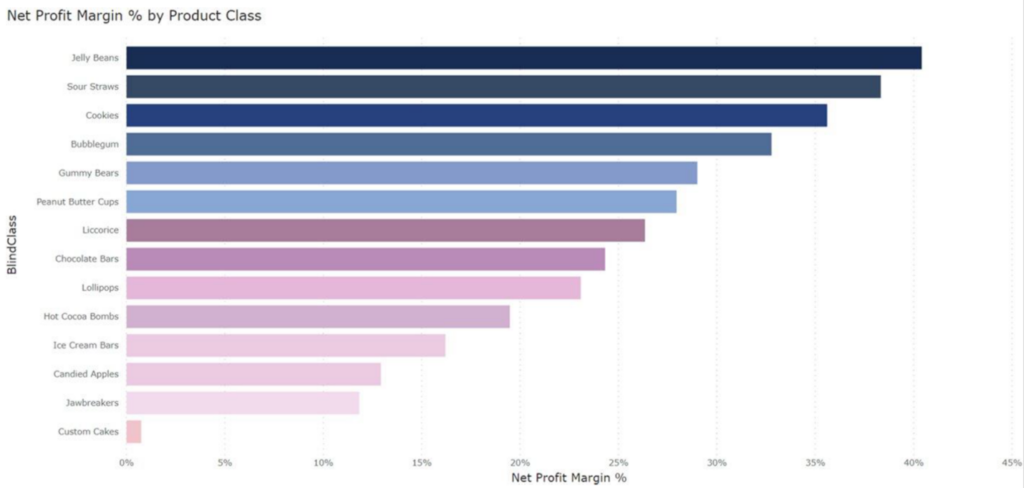
At the evaluating level, activities move beyond understanding the business problem and how sales and marketing analytics can produce a desired output, and venture into analyzing what the problem is and why it’s occurring. To illustrate this, take the example of a confectionary company. The company wants to measure customer profitability, so they start by splitting customers into two groups: those with high profitability and those with low. Within these groups, there are slight differences in the product mix of the customers. These capabilities to segment customers and visualize their product mix demonstrate this phase of analytical maturity. Turns out, the high profitability customers are buying a higher proportion of jellybeans, the highest margin product, as compared to the lower profitability group. In addition, the lower profitability customers are selling six times more hot cocoa bombs, an exciting, but low margin item. The seasonal nature and more labor-intensive manufacturing process of hot cocoa bombs takes a toll on these customers’ profitability, especially when the high profitability group is selling one sixth the amount.
Simulating
The next level of organizational maturity is through simulations and scenario plans towards a goal. Some examples of questions that analysts may consider when working through a simulation are:
- How can I get to a 40% profit margin on this customer?
- What will a 5% increase in trade do to profit margin across my top customer?
- How much can I affect profit margin if I reduce damages by 10%?
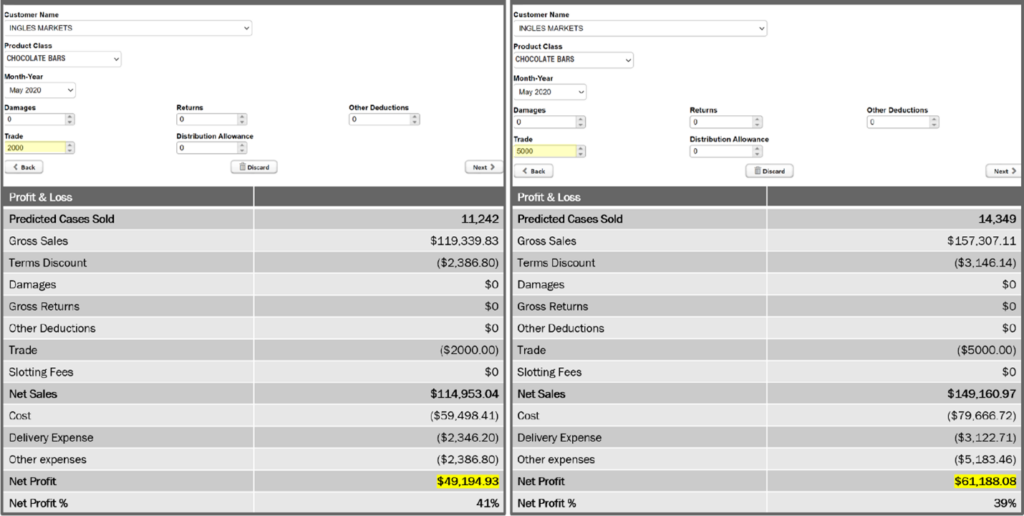
Continuing with the confectionary company example, simple arithmetic can be used to set up the framework of an organization’s profit and loss statement (P&L); gross sales less damages, deductions, trade, various expenses, etc., eventually getting to a net product margin and percentage. The exciting part, however, is that elements of the P&L like trade spend can be used to predict cases sold when combined with other pieces of data like seasonality and sales history. Using this approach, an analyst can use that predictive model and try out different values for trade spend to show the impact on cases sold. These predicted pieces can then be plugged back into the P&L to simulate different net profit results.
Continuing with the confectionary company example, let’s say the company allots $2,000 in trade for chocolate bars at one of their top customers. This trade spend delivers a $49,000 profit margin and 41% profit margin. Now if we swap out $2,000 in trade spend for $5,000, we can again simulate the P&L and now see that the profit margin grows to $61,000, with a profit margin of 39%. For just a $2,000 difference in trade, the company reconciled far more than that in overall profit.
Optimizing Sales and Marketing Analytics
The big jump when moving from “simulating” maturity to “optimizing” maturity is using your simulation analysis to maximize a goal metric. Rather than have an analyst manually try different values for trade spend and view each result, optimization allows for all of those iterations to happen automatically and then share the best result. Individual simulations are the inputs to optimization, working through iterations of analyses and gauging the performance and success of your analyses based on a target metric, such as hitting KPIs or revenue, volume, or margin goals. Some examples of questions that an optimizer will help answer are:
- Which customer will benefit the most from a trade spend increase?
- How much money do I need to invest (and where) to hit my revenue target in Q3?
- What do my trade dollars need to be next quarter to maximize net profit?
The narrative moves away from absolute metrics and matures to creating the best scenario.
Creating that best scenario is only feasible with the help of subject matter expertise. This creates the most successful optimization, in addition to the partnership being a tactic for change management and analytics adoption. Having a simulation tool demonstrates to analysts that sales and markeitng analytics are not trying to remove their say, but rather provide an elevated way to uncover insights.
The most important aspect of any analytics project is driving business value, and what that really means is driving business action. No matter the maturity level, it is important to always have actionability and quick wins in mind to continue establishing buy-in to sales and marketing analytics across your organization.
This blog post is based on a presentation Clarkston’s analytics experts Maggie Seeds and Dayna Larson gave at a KNIME event. View the presentation here.